Confidence Map
PhoXi Scanners have the resolution of 3,2 Million points, which correspond to the resolution of the 2D sensor inside (2064x1544). For each pixel in the 2D sensor there is one computed 3D point. The accuracy of the computation for each pixel is estimated by the "confidence" value, which express the error of 3D measurement in millimeters. Please note that this value is only the estimation. The real value can be obtained only by the comparison with the gold (CAD) model.
Exploring the Confidence Map in PhoXi Control
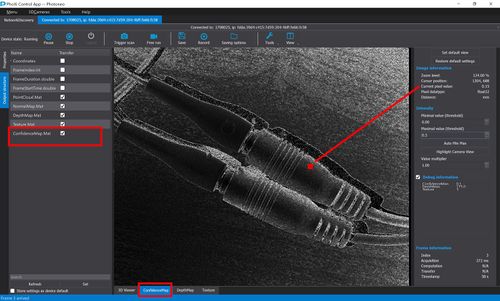
Open the "Output Structure" tab in the Left Pane, check "ConfidenceMap" checkbox and confirm by button "Set". New tab will be added into the viewer pane. Now trigger the scan and switch the current view to ConfidenceMap. Use "Maximal value" threshold in the right pane and set it to small value (e.g. 1.00 mm). The error of measurement for each pixel is now mapped into color: points with zero error will be black, points with error above 1 mm will be white and the points with error between 0-1 will have some shade of gray.
Move the mouse pointer over the pixels to see the actual confidence value (estimated error of measurement) in the right pane.
Saving the Confidence Map in the PLY
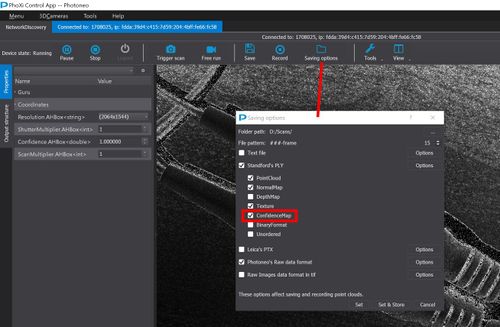
Open the Saving Options dialog and in the PLY options check "Confidence Map".
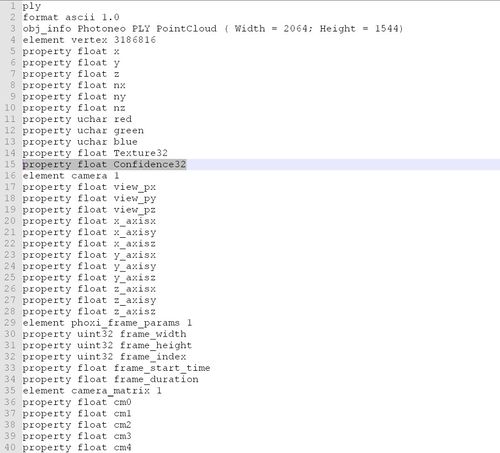
The confidence value will be added into the PLY structure.
And the information about each point will contain also the confidence value.
Explanation:
- Point coordinates [-49.9265 -3.09847 186.842]
- Point normal vector [0.359787 -0.00883223 -0.932993]
- Point color in RGB [15 15 15]
- Point color in 32bit [19]
- Confidence [0.0265961] - this means that the point was captured with the estimated accuracy of 0.0265961 mm


